Yesod is one of the most popular web frameworks in the Haskell
land. This post will explore creating a sample Postgres based Yesod
web application and then deploying it to Kubernetes cluster. We
will create a Helm chart for doing our kubernetes release. Note
that the entire source lives here:
Creating Yesod application
The first step would be to create a sample Yesod application
using the Stack build tool:
$ stack new yesod-demo yesod-postgres
Now, I will add an additional model to the existing scaffolding
site:
Person json
    name Text
    age Int
    deriving Show
And also add four new routes to the application:
/person PersonR GET POST

/health/liveness LivenessR GET
/health/readiness ReadinessR GET
The /health based handlers are for the basic health
checking of your application. Every kubelet in the worker node will
perform a periodic diagnostic check to determine the health of your
web application. Based on the result, it will perform an
appropriate action (such as restarting your failed container).
Now let’s define some Yesod handlers for the above routes:
postPersonR :: Handler RepJson
postPersonR = do
  person :: Person <- requireJsonBody
  runDB $ insert_ person
  return $ repJson $ toJSON person

getPersonR :: Handler RepJson
getPersonR = do
  persons :: [Entity Person] <- runDB $ selectList [] []
  return $ repJson $ toJSON persons

getLivenessR :: Handler ()
getLivenessR = return ()

getReadinessR :: Handler RepJson
getReadinessR = do
  person :: [Entity Person] <- runDB $ selectList [] [LimitTo 1]
  return $ repJson $ toJSON person
The postPersonR function will insert a
Person object in the database and the
getPersonR function will return the list of all
Person in the database. The other two handlers are for
the probe checks which are performed by the kubelet. I have
provided simplified implementation for them. The liveness probe is
to tell the kubelet if the container is running. If it isn’t
running, then the container is killed and based on the restart
policy, an appropriate action is taken. The readiness probe on the
otherhand informs the kubelet if the container is ready to service
requests. You can read more about them here.
Building Docker Image
Now, I will update the stack.yaml file to build a
docker image for our application:
image:
  container:
    name: psibi/yesod-demo:3.0
    base: fpco/stack-build
    add:
      static: /app

    entrypoints:
    - yesod-demo

docker:
  enable: true
Note that the name of the docker image is specified as
psibi/yesod-demo:3.0. Also, I’m adding the
static directory inside the container so that it can
be served properly by the server. Now, doing stack image
container will build the docker image. You can verify it
using the docker tool:
 $ docker images
REPOSITORY                 TAG                 IMAGE ID            CREATED             SIZE
psibi/yesod-demo           3.0-yesod-demo      8e32c1329557        46 hours ago        7.92GB
Now, I will push it to the docker registry:
$ docker push psibi/yesod-demo:3.0-yesod-demo
Deployment to Kubernetes
Given that our application is available in the docker hub now, you can move on to create Kubernetes
manifests and get ready for deploying our yesod application. Since
our application has PostgreSQL as database backend, we will make
use of the existing helm postgres chart for it.
Note that for a mission critical workloads, something like RDS would be a better choice. Let’s create a helm
chart for our application:
$ helm create yesod-postgres-chart
Creating yesod-postgres-chart
$ tree yesod-postgres-chart/
yesod-postgres-chart/
├── charts
├── Chart.yaml
├── templates
│   ├── deployment.yaml
│   ├── _helpers.tpl
│   ├── ingress.yaml
│   ├── NOTES.txt
│   └── service.yaml
└── values.yaml

2 directories, 7 files
Now I would create a requirements.txt file inside
the folder and define our postgresql dependency there:
dependencies:
  - name: postgresql
    version: 0.15.0
    repository: https://kubernetes-charts.storage.googleapis.com
Now, let’s configure the postgresql helm chart from
our values.yaml file:
postgresql:
  postgresUser: postgres
  postgresPassword: your-postgresql-password
  postgresDatabase: yesod-test
  persistence:
    storageClass: ssd-slow
Note that we are also providing a storageClass named
ssd-slow in the above file. So, you would have to
provision that in the k8s cluster. Using the
StorageClass, the postgres helm chart will create
volumes on demand. All the k8s manifests
goes inside the templates directory. Let’s first
create the above storageClass resource:
kind: StorageClass
apiVersion: storage.k8s.io/v1
metadata:
  name: ssd-slow
provisioner: kubernetes.io/aws-ebs
parameters:
  type: gp2
Kubernetes has a concept of ConfigMap and Secret to store
special configuration and secret (duh!) data. Let’s define the
ConfigMap resource for our yesod application:
apiVersion: v1
data:
  yesod_static_path: /app
  yesod_db_name: yesod-test
  yesod_db_port: "5432"
  yesod_host_name: "{{ .Release.Name  }}-postgresql"
kind: ConfigMap
metadata:
  name: {{ template "yesod-postgres-chart.full_name" . }}-configmap
We have previously seen in our stack.yaml that our
static folder is added under /app, so
corresponding we give the proper path to the key
yesod_static_path. I have defined some helper
functions in the file _helpers.tpl which I’m using now
for the generation of metadata.name. We will be using
these helper function throughout our template. Now, let’s define
the Secret manifest for your application:
apiVersion: v1
kind: Secret
metadata:
  name: {{ template "yesod-postgres-chart.full_name" . }}-secret
type: Opaque
data:
  yesod-db-password: {{ .Values.postgresql.postgresPassword | b64enc | quote }}
  yesod-db-user: {{ .Values.postgresql.postgresUser | b64enc | quote }}
Now comes the important part - Deployment manifest. They
basically are a controller which will manager your pods. This
manifest for our application is slightly bigger:
apiVersion: extensions/v1beta1
kind: Deployment
metadata:
  name: {{ template "yesod-postgres-chart.full_name" . }}
spec:
  replicas: 1
  template:
    metadata:
      labels:
        {{- include "yesod-postgres-chart.release_labels" . | indent 8 }}
    spec:
      containers:
        - name: yesod-demo
          image: {{ .Values.image.repository }}:{{ .Values.image.tag }}
          resources:
{{ toYaml .Values.yesodapp.resources | indent 12 }}
          livenessProbe:
            httpGet:
              path: /health/liveness
              port: 3000
              scheme: HTTP
              initialDelaySeconds: 30
              periodSeconds: 15
              timeoutSeconds: 5
          readinessProbe:
            httpGet:
              path: /health/readiness
              port: 3000
              scheme: HTTP
            initialDelaySeconds: 30
            timeoutSeconds: 1
          env:
            - name: YESOD_STATIC_DIR
              valueFrom:
                configMapKeyRef:
                  name: {{ template "yesod-postgres-chart.full_name" . }}-configmap
                  key: yesod_static_path
            - name: YESOD_PGPORT
              valueFrom:
                configMapKeyRef:
                  name: {{ template "yesod-postgres-chart.full_name" . }}-configmap
                  key: yesod_db_port
            - name: YESOD_PGHOST
              valueFrom:
                configMapKeyRef:
                  name: {{ template "yesod-postgres-chart.full_name" . }}-configmap
                  key: yesod_host_name
            - name: YESOD_PGDATABASE
              valueFrom:
                configMapKeyRef:
                  name: {{ template "yesod-postgres-chart.full_name" . }}-configmap
                  key: yesod_db_name
            - name: YESOD_PGUSER
              valueFrom:
                secretKeyRef:
                  name: {{ template "yesod-postgres-chart.full_name" . }}-secret
                  key: yesod-db-user
            - name: YESOD_PGPASS
              valueFrom:
                secretKeyRef:
                  name: {{ template "yesod-postgres-chart.full_name" . }}-secret
                  key: yesod-db-password
While the above file may look complex, it’s actually quite
simple. We are specifying the docker image in
spec.containers.image and the compute resources in
spec.containers.resources. Then we specify the
liveness and readiness probe with the proper path which we defined
earlier. After that we define the environment variables which are
required for proper running of this application. We fetch the
variables from the configmaps and secrets we defined earlier.
The final step is to create a Service manifest which will act as
a persistent endpoints for the pods created out of deployment.
Services use labels to select a particular pod. This is our Service
definition:
kind: Service
apiVersion: v1
metadata:
  name: {{ template "yesod-postgres-chart.full_name" . }}
  labels:
    {{- include "yesod-postgres-chart.release_labels" . | indent 4 }}
spec:
  selector:
    app: {{ template "yesod-postgres-chart.full_name" . }}
  ports:
    - protocol: "TCP"
      port: 3100
      targetPort: 3000
  type: ClusterIP
In the above file, you have defined the service type as
ClusterIP. That makes our service only reachable
within the cluster. Through spec.ports.targetPort we
indicate the actual port on the POD where our service is running.
Since our yesod application runs on port 3000 on the container, we
specify it appropriately. The spec.ports.port
indicates the port in which it will be available to other services
in the cluster. Now, I will add nginx deployment on top of this
which will route the requests to our yesod application. I won’t
show it’s Deployment manifest as it’s quite similar to the previous
one we saw, but it’s Service object is interesting:
kind: Service
apiVersion: v1
metadata:
  name: {{ template "yesod-nginx-resource.full_name" . }}
spec:
  selector:
    {{- include "yesod-nginx-resource.release_labels" . | indent 4 }}
  ports:
    - protocol: "TCP"
      port: 80
      targetPort: 80
  type: LoadBalancer
The type LoadBalancer will expose the service using
the underlying cloud’s load balancer. Once you have the entire
thing ready, you can install the chart:
helm install . --name="yesod-demo"
It will take some time for our pods to get up and start
servicing the requests. We specify the release name as
yesod-demo. You can find the load balancer DNS name by
querying using kubectl:
$ kubectl get services
NAME                              TYPE           CLUSTER-IP       EXTERNAL-IP                                                               PORT(S)        AGE
kubernetes                        ClusterIP      172.20.0.1       <none>                                                                    443/TCP        12d
nginx-yesod-demo-yesod-postgres-chart   LoadBalancer   172.20.155.194   a0d96c1a5a14a11e88a68065a88681d5-2013621451.us-west-2.elb.amazonaws.com   80:31578/TCP   3d
yesod-demo-postgresql                   ClusterIP      172.20.173.246   <none>                                                                    5432/TCP       3d
yesod-demo-yesod-postgres-chart         ClusterIP      172.20.125.142   <none>                                                                    3100/TCP       3d
To see the log of the yesod application:
$ kubectl get pods
NAME                                            READY     STATUS    RESTARTS   AGE
nginx-yesod-demo-yesod-postgres-chart-f4f5979-2w6s9   1/1       Running   0          3d
yesod-demo-postgresql-786b4cc4-dwpph                  1/1       Running   0          3d
yesod-demo-yesod-postgres-chart-7bcb474796-xdbfd      1/1       Running   0          11h
$ kubectl logs -f yesod-demo-yesod-postgres-chart-7bcb474796-xdbfd
10.0.0.28 - - [19/Aug/2018:17:13:11 +0000] "GET /health/liveness HTTP/1.1" 200 0 "" "kube-probe/1.10"
10.0.0.28 - - [19/Aug/2018:17:13:21 +0000] "GET /health/liveness HTTP/1.1" 200 0 "" "kube-probe/1.10"
10.0.0.28 - - [19/Aug/2018:17:13:31 +0000] "GET /health/liveness HTTP/1.1" 200 0 "" "kube-probe/1.10"
10.0.0.28 - - [19/Aug/2018:17:13:38 +0000] "GET /health/readiness HTTP/1.1" 200 33 "" "kube-probe/1.10"
10.0.0.28 - - [19/Aug/2018:17:13:41 +0000] "GET /health/liveness HTTP/1.1" 200 0 "" "kube-probe/1.10"
10.0.0.28 - - [19/Aug/2018:17:13:48 +0000] "GET /health/readiness HTTP/1.1" 200 33 "" "kube-probe/1.10"
10.0.0.28 - - [19/Aug/2018:17:13:51 +0000] "GET /health/liveness HTTP/1.1" 200 0 "" "kube-probe/1.10"
10.0.0.28 - - [19/Aug/2018:17:13:58 +0000] "GET /health/readiness HTTP/1.1" 200 33 "" "kube-probe/1.10"
10.0.0.28 - - [19/Aug/2018:17:14:01 +0000] "GET /health/liveness HTTP/1.1" 200 0 "" "kube-probe/1.10"
10.0.0.28 - - [19/Aug/2018:17:14:08 +0000] "GET /health/readiness HTTP/1.1" 200 33 "" "kube-probe/1.10"
You can see in the logs of our pod, that the web application is
being continously probed by diagnostic checks. Let’s confirm that
our web application is indeed working:
$ curl --header "Content-Type: application/json" --request POST --data '{"name":"Sibi","age":"32"}' https://a0d96c1a5a14a11e88a68065a88681d5-2013621451.us-west-2.elb.amazonaws.com
$ curl --header "Content-Type: application/json" --request POST --data '{"name":"Sibi","age":32}' https://a0d96c1a5a14a11e88a68065a88681d5-2013621451.us-west-2.elb.amazonaws.com/person
{"age":32,"name":"Sibi"}⏎
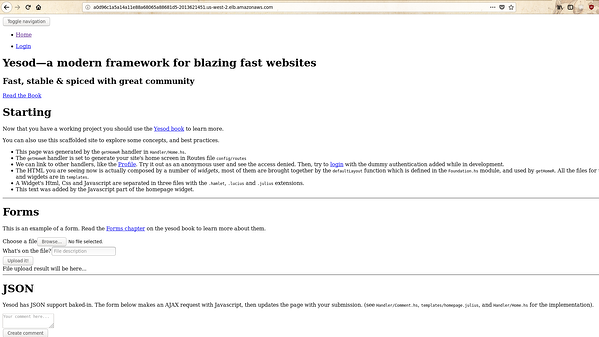
Now, if you do a curl request on the index page, then you will
observe that the urls in the web application won’t be correct.
Yesod, by default put’s the hostname in the url according to the
configuration present in settings.yml file. You will
be seeing the hostname of the pod in your linked urls. It will
render improperly in your browser because of this:

There are three ways to tackle this problem:
- Override Approot in Yesod typeclass instance: This is the most
straightforward approach and I would just define approot to
ApprootRelative so that there is no root URL. You can
see the other options here..
- Another option is to find out the load balancer’s DNS Name
after kubernetes is deployed and pass new environment variable for
your yesod application in accordance with your
settings.yml file. But this would mean deploying again
using helm upgrade. I dislike this approach as it
involves multiple deployment using Helm. There is currently an
open issue in Helm related to this.
- The third option is to call the Kubernetes API from your web
application as a part of initialization step and get the DNS name
dynamically and update your application settings accordingly. You
have to use the Services API for achieving
it.
For this demo application, let’s use the first approach and
deploy a new image with tag 4.0:
$ docker push psibi/yesod-demo:4.0-yesod-demo
Now, let’s update the values.yaml file to the
newest tag of the image and then upgrade the deployment using
helm:
$ helm upgrade yesod-demo .
Now, you can indeed verify that the pod has updated to the new
image
$ kubectl describe pod yesod-demo-yesod-postgres-chart-7bcb474796-xdbfd | grep Image
    Image:          psibi/yesod-demo:4.0-yesod-demo
    Image ID:       docker-pullable://psibi/yesod-demo@sha256:5d22e4dfd4ba4050f56f02f0b98eb7ae92d78ee4b5f2e6a0ec4fd9e6f9a068c7
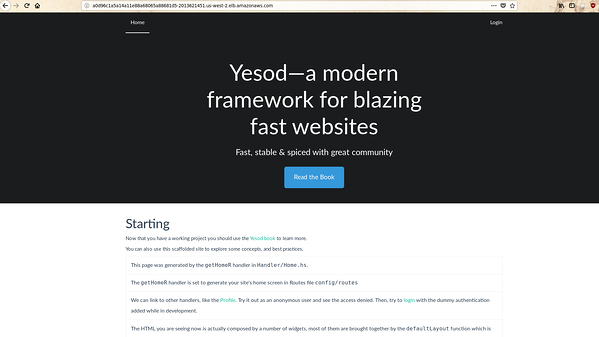
Try visiting the homepage and you can observe that all the
static resources of your yesod application would have properly
loaded this time.

As you can see your application loads properly now. This
concludes our post on deploying our Yesod application to
Kubernetes. Let me know if you have any questions/queries through
the comments section.
Subscribe to our blog via email
Email subscriptions come from our Atom feed and are handled by Blogtrottr. You will only receive notifications of blog posts, and can unsubscribe any time.
Do you like this blog post and need help with Next Generation Software Engineering, Platform Engineering or Blockchain & Smart Contracts? Contact us.